EXH-02sample entry — swap with a real artifact
Tidewatch
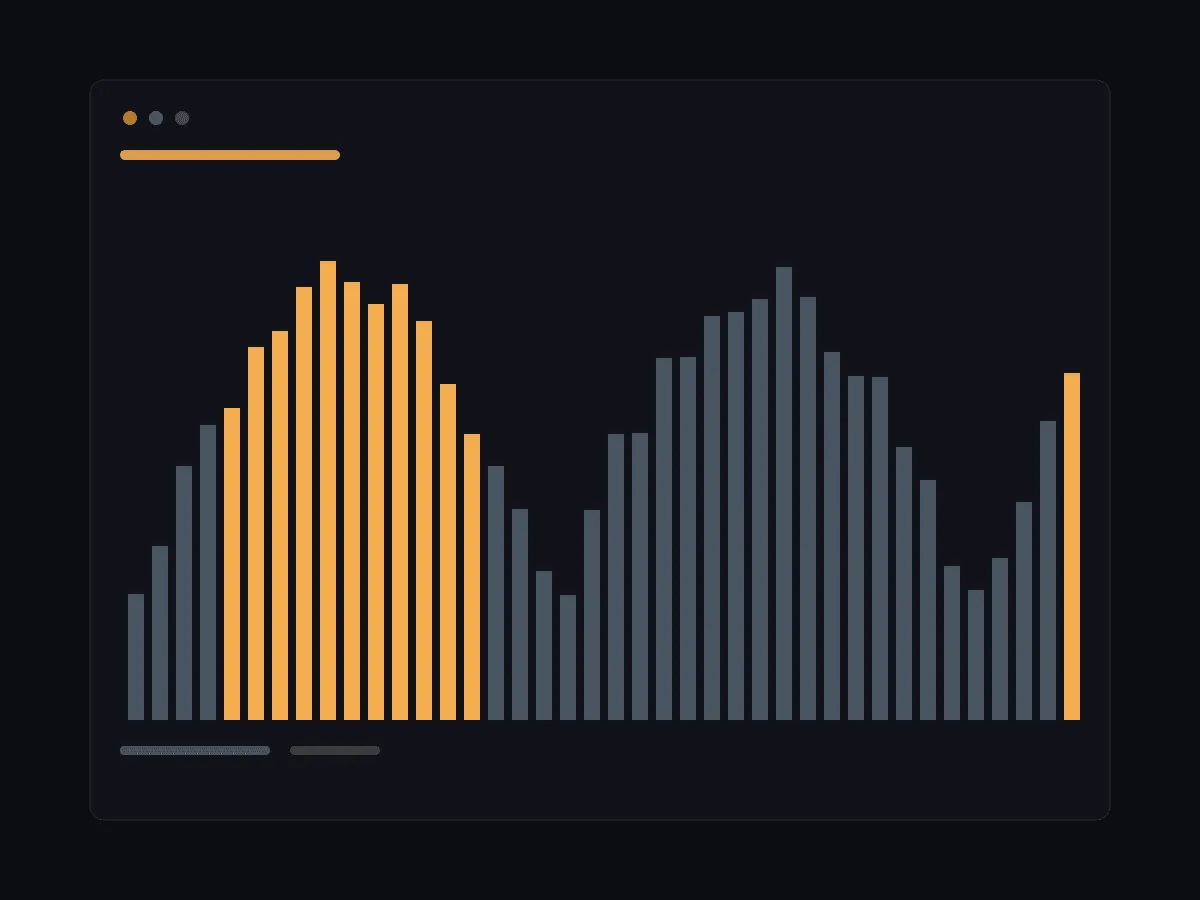
A terminal-styled analytics dashboard that renders 90 days of traffic as tide charts — static HTML, data baked at build time.
The prompt · verbatim
Why it works
- “No chart library” forces craft. Styled divs and template-generated SVG keep the page at zero client JS — and the constraint is visible in the result, which is the point of the exhibit.
- Color is given a semantic job (“rising gets the accent, falling stays muted”), which is what separates a designed dashboard from a default one.
- Failure behavior is specified. “Fail the build loudly” turns a silent placeholder bug into a build error — prompts that specify the unhappy path produce production-grade output.